State Diagram, State Table
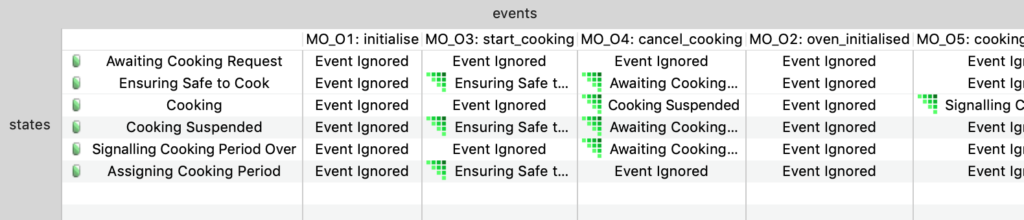
The state transition diagram is a graphical representation of a finite state machine in an executable UML model. The states are the rounded boxes; transitions are the arrows between. Events label the transitions, and activities can be expressed as action language in the states or on the transitions. A state event matrix (or state transition […]